In the fast-paced and complex hospital and healthcare industry, the operating room (OR) stands out as a critical hub where efficiency, safety, and quality intersect. Healthcare administrators and surgical teams must have access to real-time, actionable data to guide decision-making and improve outcomes. This is where operating room or perioperative analytics and quality indicators play an essential role, offering a panoramic view of OR performance and patient care quality. By having access to an efficient and effective performance dashboard, your team can not only facilitate immediate operational adjustments but also support long-term strategic planning and continuous improvement efforts.
Operating room dashboards aggregate a wide array of data points into an accessible and interpretable format, enabling surgical teams and hospital administrators to monitor key performance indicators (KPIs) at a glance. Metrics such as surgical volume, OR utilization rates, case mix index, and first-case on-time starts are pivotal for assessing efficiency. Meanwhile, quality indicators like surgical site infection rates, complication rates, and patient satisfaction scores provide invaluable insights into the quality of care being delivered. Together, these metrics form a comprehensive overview of OR operations, pinpointing areas of excellence and identifying opportunities for enhancement.
The Power of Dashboard Metrics & KPIs for the OR
The real power of OR dashboard metrics and quality indicators lies in their ability to drive improvements in patient outcomes and operational efficiency. By closely monitoring these metrics, healthcare providers can implement targeted interventions to reduce surgical wait times, optimize scheduling, and improve surgical preparedness. This not only enhances patient satisfaction and safety, but also maximizes the use of available resources, potentially leading to significant cost savings or revenue increases. Moreover, the data-driven insights gained from these dashboards support evidence-based decisions, ensuring that changes to protocols or processes are grounded in solid empirical evidence.
Examples of Perioperative Analytics’ KPI Metrics
Volume Indicators
- Surgical Procedure Types: Frequencies, durations, and outcomes of specific surgical procedures. This includes the number of each type of surgery performed, how long each surgery takes, and the results of these surgeries.
- Preoperative Assessments: Data on patient health evaluations, risk assessments, and pre-surgical screenings. This reflects the volume of preoperative activity and preparation for surgeries.
Utilization Indicators
- Resource Utilization: Usage of surgical instruments, consumables, and technologies during procedures. This indicates how effectively surgical resources are being used.
- Operational Metrics: Specifically, operating room utilization rates part of operational metrics directly relate to how efficiently surgical suites are utilized.
Operational Indicators
- Complication Rates: Types and rates of surgical complications, both intraoperative and postoperative. This impacts operational efficiency and patient flow.
- Surgeon Performance Metrics: Surgeon-specific outcomes, including complication rates, surgery durations, and patient recovery times. This affects overall operational effectiveness and efficiency.
- Operational Metrics: (Excluding OR utilization rates mentioned under utilization indicators) Scheduling efficiency and wait times for surgery. This encompasses the broader aspects of operational efficiency in managing surgical schedules and reducing patient wait times.
- Postoperative Care Metrics: Complication rates, length of hospital stay, and discharge outcomes. These metrics are crucial for evaluating the efficiency of postoperative care and its impact on operational capacity.
Financial Indicators
- Cost and Reimbursement Data: Financial data related to surgical procedures, including costs, billing codes, and reimbursement rates. This is key for understanding the financial impact of surgical operations on the healthcare facility.
Patient-Centered Indicators (Cross-Category)
- Patient Outcomes: Survival rates, recovery times, readmission rates, and long-term health outcomes post-surgery. While not strictly falling into one of the above categories, these are critical for assessing the effectiveness of surgical care and have implications across volume, operational, and financial metrics.
- Patient Satisfaction Scores: Patient feedback on their surgical experience, including preoperative and postoperative care. Similar to patient outcomes, satisfaction scores are a vital measure of service quality and impact several aspects of operational and financial performance.
How Qventus Helps Enhance Care Efficiency with Data
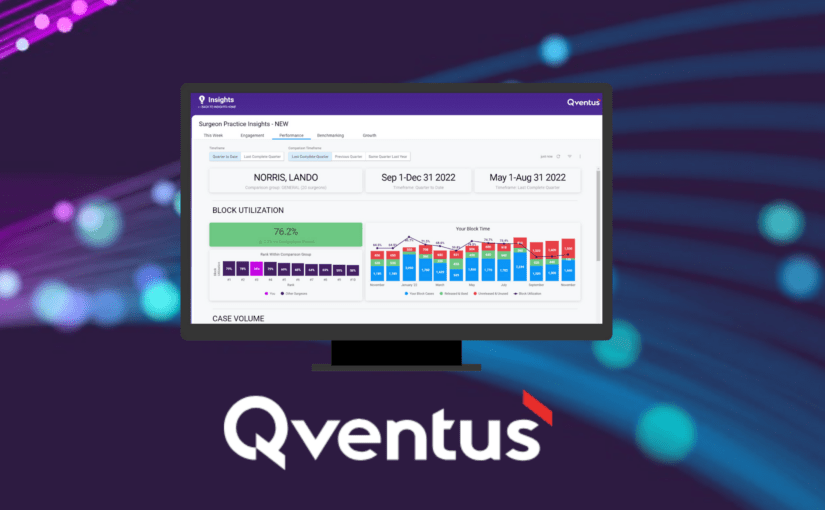
In the era of value-based care, the emphasis on quality and efficiency has never been higher. OR dashboards and perioperative analytics help to establish the best KPIs for your organization and play a pivotal role in providing a mechanism for continuous quality improvement as well as compliance with regulatory standards. That’s why Qventus offers a comprehensive perioperative solution designed to enhance the efficiency and effectiveness of operating room operations. Some of the key performance indicators (KPIs) included in this solution are:
Examples of Perioperative & OR Analytics KPIs:
- Block Utilization: Measures the efficiency of operating room block time usage.
- Block Cases: Tracks the number of cases handled within each block.
- Released Times: Monitors the instances when scheduled block times are released back to the hospital for reassignment.
- Unused Times: Identifies block times that were not used, highlighting potential areas for improvement.
Additionally, Qventus provides an inpatient solution that focuses on improving patient throughput and quality of care within the hospital setting. Some KPIs for this solution include:
Examples of Inpatient Solution KPIs:
- Length of Stay: Measures the duration of a patient’s hospital stay to gauge efficiency in patient flow and resource utilization.
- Kudos and Coaching Opportunities: Tracks recognition and development opportunities, enhancing staff engagement and performance.
- Discharge Quality Score (Q Score) by Unit: Evaluates the quality of the discharge process on a unit-by-unit basis.
- Trend Analysis Over Time: Provides longitudinal data analysis to observe changes and trends in patient care and outcomes over time.
These KPIs empower healthcare teams with actionable insights, enabling them to optimize both surgical performance and inpatient care processes. Through its targeted analytics, Qventus helps healthcare facilities not only improve operational efficiency, but also enhance patient outcomes and satisfaction.


